
News
Distracted driving offenses in Pennsylvania

April 04, 2025
Pennsylvania had over 10,000 offenses reported between 2020 and 2024. New data reveals that people in their 20’s are the most common offenders and violations peak between 10 a.m. and noon.
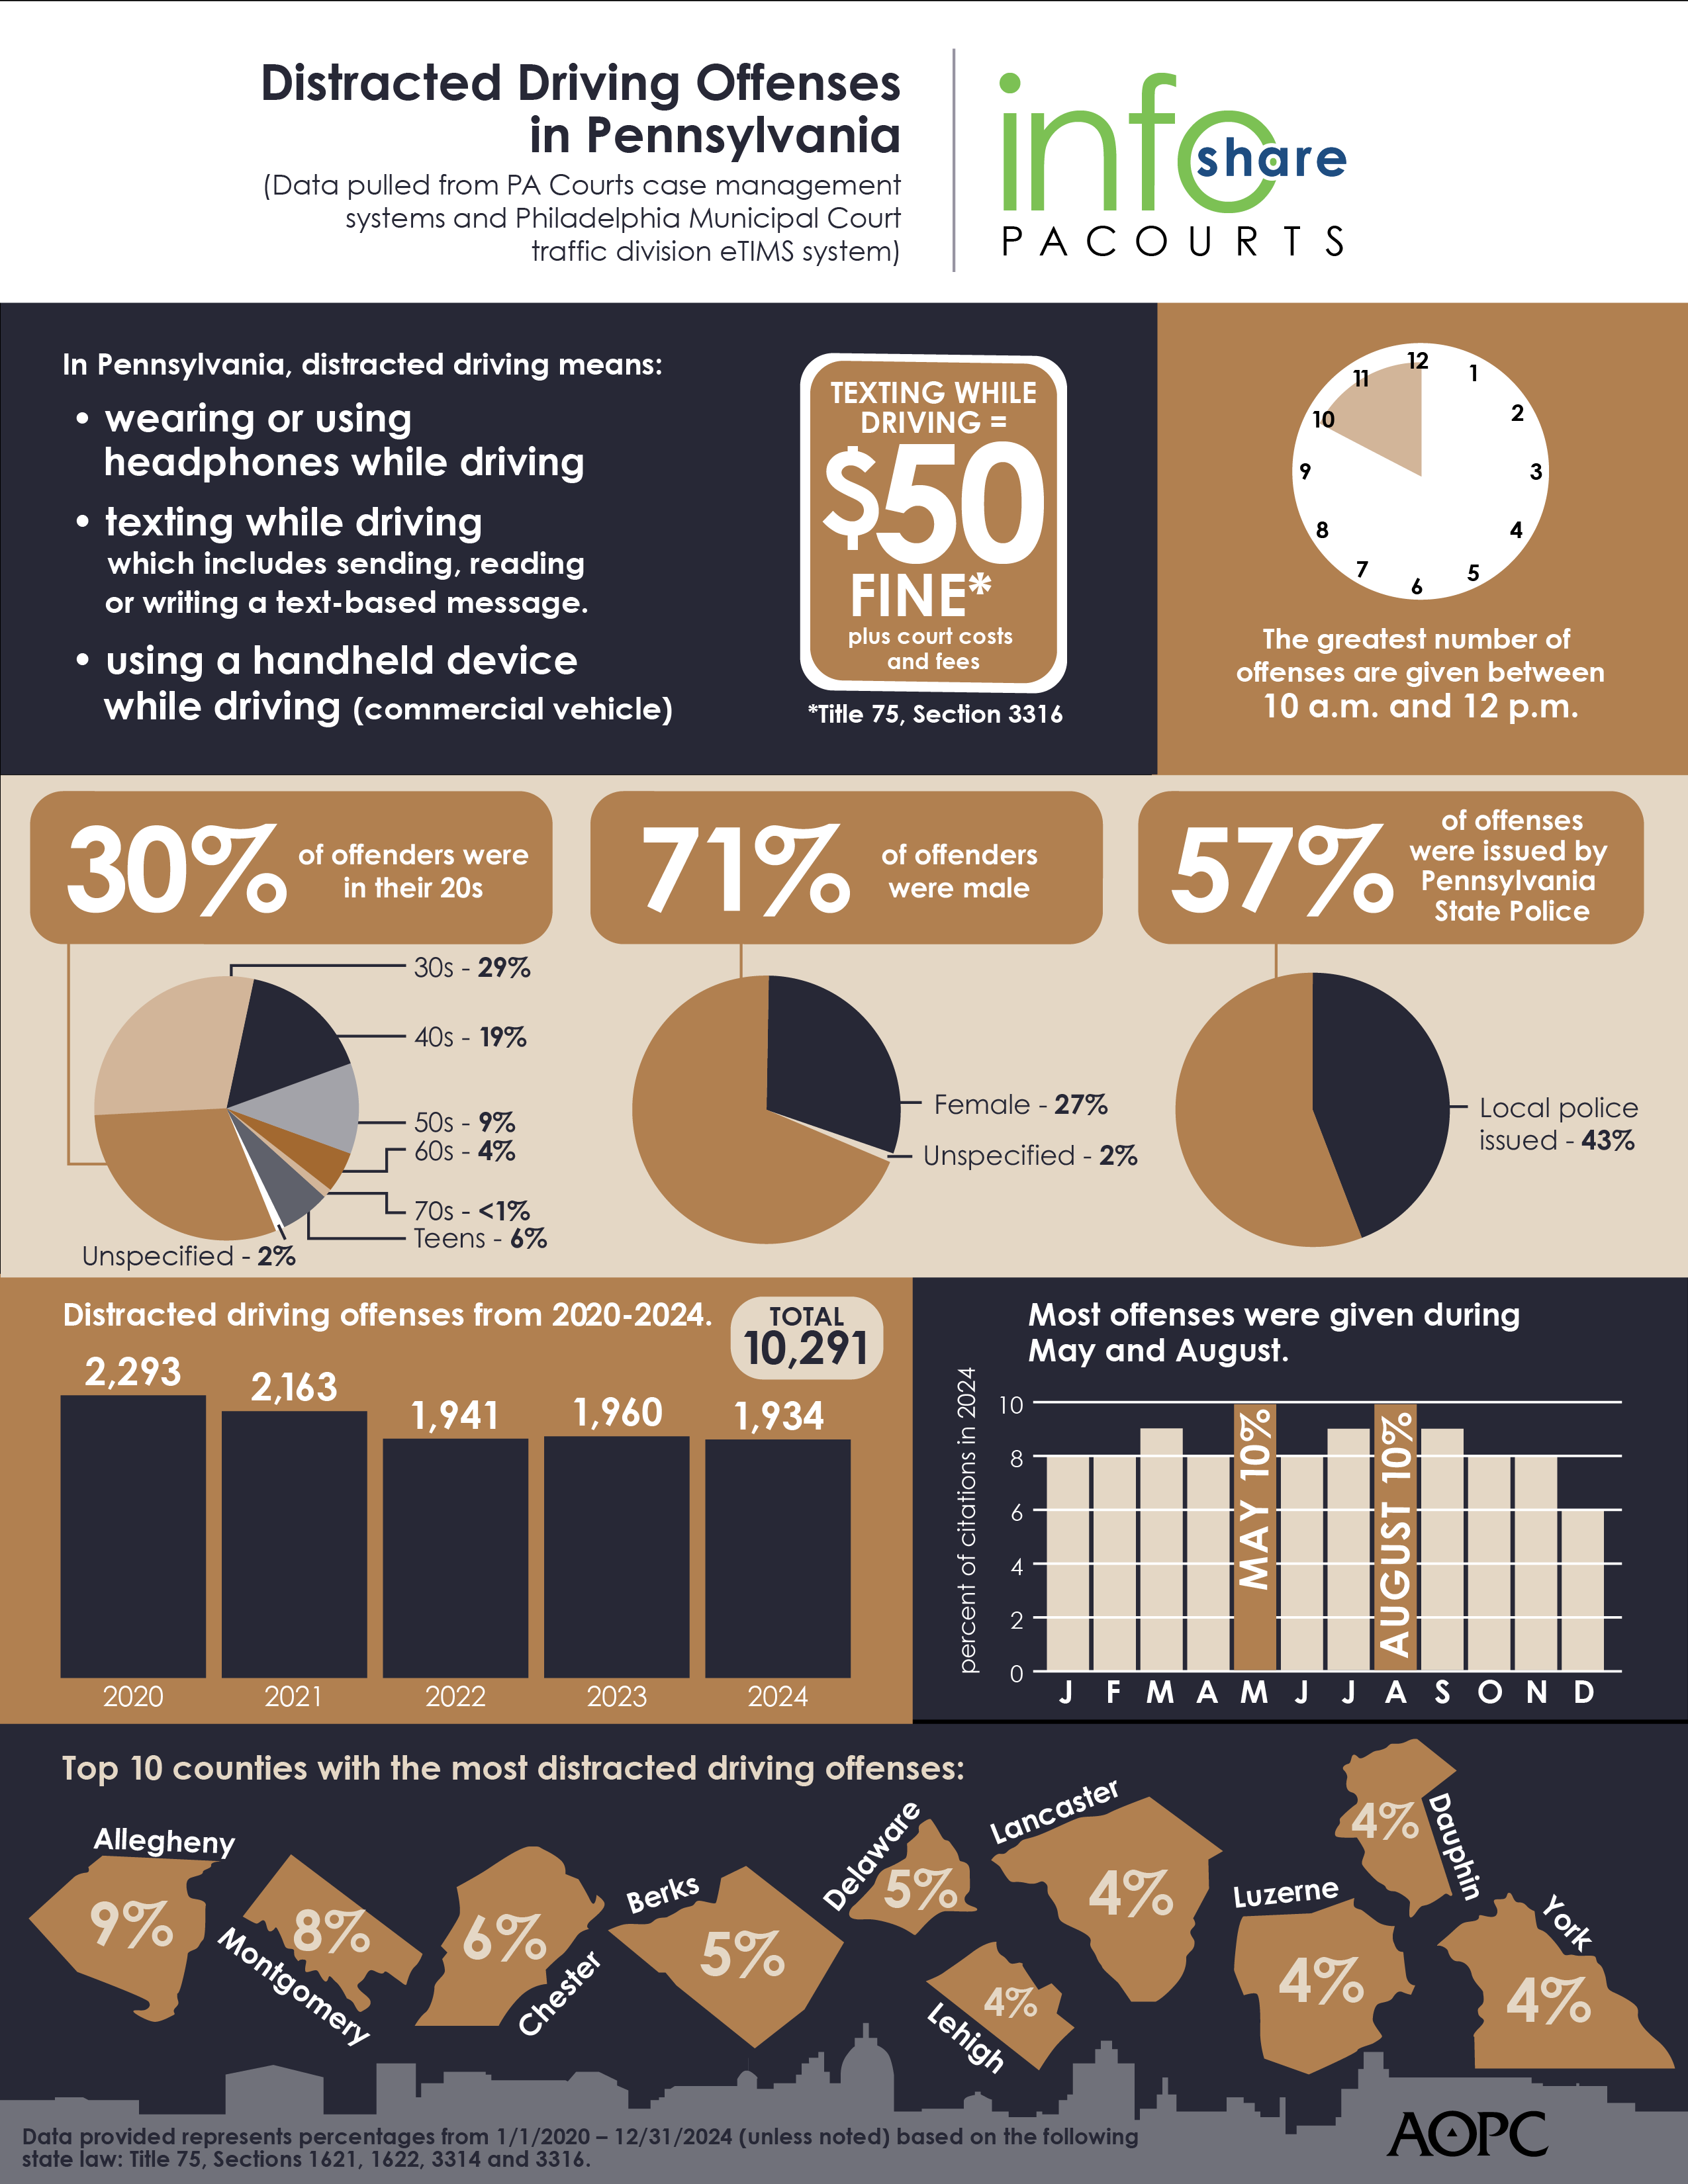
Distracted driving offenses in Pennsylvania can be issued for 1) using headphones while driving, 2) using a handheld mobile phone while driving a commercial vehicle or 3) texting while driving. Texting includes sending, reading or writing a text-based message.
The infographic highlights key data and demographics about distracted drivers in Pennsylvania over the last five years (2020 – 2024). A high-resolution file of the graphic is available for download at www.pacourts.us under Media Resources. See editor’s note for detailed county data.
PA Courts InfoShare is a monthly product of the Administrative Office of Pennsylvania Courts (AOPC) that visually highlights the work of the courts with interesting data and statistics obtained through the judiciary’s case management systems, interactive dashboards and other research. Reproduction is permissible with source cited.
###
Media contact: Olivia Antonucci, 609-238-5182
Editor’s Note:
|
Statewide Count of distracted driving offenses filed from 1/1/2020 through 12/31/2024, as recorded in the Magisterial District Judge System (MDJS) and Philadelphia Municipal Court Traffic Division eTIMS System; Grouped by County |
||||||||
|
County |
2020 |
2021 |
2022 |
2023 |
2024 |
Total |
Percentage of Total |
|
|
Adams |
37 |
31 |
18 |
27 |
26 |
139 |
1.35% |
|
|
Allegheny |
197 |
219 |
153 |
172 |
156 |
897 |
8.72% |
|
|
Armstrong |
8 |
8 |
8 |
7 |
5 |
36 |
0.35% |
|
|
Beaver |
15 |
10 |
17 |
17 |
12 |
71 |
0.69% |
|
|
Bedford |
17 |
11 |
11 |
25 |
5 |
69 |
0.67% |
|
|
Berks |
103 |
83 |
82 |
84 |
184 |
536 |
5.21% |
|
|
Blair |
16 |
18 |
9 |
14 |
19 |
76 |
0.74% |
|
|
Bradford |
5 |
7 |
14 |
11 |
8 |
45 |
0.44% |
|
|
Bucks |
60 |
56 |
52 |
53 |
63 |
284 |
2.76% |
|
|
Butler |
35 |
21 |
32 |
30 |
23 |
141 |
1.37% |
|
|
Cambria |
12 |
11 |
11 |
9 |
4 |
47 |
0.46% |
|
|
Cameron |
1 |
1 |
0 |
1 |
0 |
3 |
0.03% |
|
|
Carbon |
18 |
19 |
15 |
13 |
11 |
76 |
0.74% |
|
|
Centre |
13 |
12 |
10 |
18 |
12 |
65 |
0.63% |
|
|
Chester |
116 |
102 |
116 |
116 |
119 |
569 |
5.53% |
|
|
Clarion |
16 |
4 |
8 |
21 |
11 |
60 |
0.58% |
|
|
Clearfield |
22 |
10 |
18 |
17 |
8 |
75 |
0.73% |
|
|
Clinton |
12 |
15 |
12 |
5 |
3 |
47 |
0.46% |
|
|
Columbia |
37 |
25 |
38 |
18 |
13 |
131 |
1.27% |
|
|
Crawford |
38 |
16 |
12 |
9 |
18 |
93 |
0.90% |
|
|
Cumberland |
113 |
95 |
58 |
51 |
43 |
360 |
3.50% |
|
|
Dauphin |
106 |
75 |
73 |
75 |
42 |
371 |
3.61% |
|
|
Delaware |
80 |
95 |
109 |
89 |
149 |
522 |
5.07% |
|
|
Elk |
4 |
16 |
6 |
6 |
5 |
37 |
0.36% |
|
|
Erie |
37 |
44 |
43 |
28 |
29 |
181 |
1.76% |
|
|
Fayette |
16 |
22 |
21 |
20 |
8 |
87 |
0.85% |
|
|
Forest |
4 |
2 |
3 |
1 |
3 |
13 |
0.13% |
|
|
Franklin |
59 |
40 |
45 |
50 |
42 |
236 |
2.29% |
|
|
Fulton |
6 |
3 |
3 |
1 |
3 |
16 |
0.16% |
|
|
Greene |
1 |
5 |
17 |
8 |
5 |
36 |
0.35% |
|
|
Huntingdon |
2 |
4 |
4 |
8 |
2 |
20 |
0.19% |
|
|
Indiana |
5 |
7 |
5 |
7 |
4 |
28 |
0.27% |
|
|
Jefferson |
35 |
10 |
11 |
12 |
13 |
81 |
0.79% |
|
|
Juniata |
8 |
2 |
6 |
5 |
5 |
26 |
0.25% |
|
|
Lackawanna |
47 |
45 |
39 |
51 |
56 |
238 |
2.31% |
|
|
Lancaster |
82 |
58 |
81 |
81 |
59 |
361 |
3.51% |
|
|
Lawrence |
8 |
13 |
11 |
10 |
9 |
51 |
0.50% |
|
|
Lebanon |
26 |
28 |
20 |
33 |
19 |
126 |
1.22% |
|
|
Lehigh |
90 |
78 |
64 |
98 |
76 |
406 |
3.95% |
|
|
Luzerne |
83 |
84 |
94 |
108 |
88 |
457 |
4.44% |
|
|
Lycoming |
15 |
12 |
11 |
6 |
16 |
60 |
0.58% |
|
|
McKean |
7 |
6 |
9 |
12 |
9 |
43 |
0.42% |
|
|
Mercer |
27 |
30 |
17 |
26 |
20 |
120 |
1.17% |
|
|
Mifflin |
2 |
7 |
4 |
6 |
6 |
25 |
0.24% |
|
|
Monroe |
46 |
35 |
40 |
30 |
34 |
185 |
1.80% |
|
|
Montgomery |
188 |
221 |
150 |
122 |
158 |
839 |
8.15% |
|
|
Montour |
0 |
3 |
3 |
3 |
3 |
12 |
0.12% |
|
|
Northampton |
51 |
54 |
40 |
35 |
45 |
225 |
2.19% |
|
|
Northumberland |
22 |
8 |
5 |
9 |
10 |
54 |
0.52% |
|
|
Perry |
6 |
10 |
6 |
10 |
6 |
38 |
0.37% |
|
|
Philadelphia |
74 |
61 |
56 |
41 |
49 |
281 |
2.73% |
|
|
Pike |
11 |
12 |
10 |
9 |
9 |
51 |
0.50% |
|
|
Potter |
2 |
7 |
6 |
6 |
3 |
24 |
0.23% |
|
|
Schuylkill |
14 |
28 |
18 |
24 |
12 |
96 |
0.93% |
|
|
Snyder |
13 |
17 |
12 |
13 |
4 |
59 |
0.57% |
|
|
Somerset |
16 |
6 |
10 |
5 |
6 |
43 |
0.42% |
|
|
Sullivan |
2 |
0 |
1 |
0 |
3 |
6 |
0.06% |
|
|
Susquehanna |
14 |
21 |
25 |
20 |
11 |
91 |
0.88% |
|
|
Tioga |
3 |
7 |
10 |
5 |
7 |
32 |
0.31% |
|
|
Union |
5 |
4 |
3 |
6 |
5 |
23 |
0.22% |
|
|
Venango |
22 |
21 |
10 |
7 |
4 |
64 |
0.62% |
|
|
Warren |
3 |
6 |
3 |
2 |
7 |
21 |
0.20% |
|
|
Washington |
34 |
25 |
18 |
38 |
21 |
136 |
1.32% |
|
|
Wayne |
5 |
8 |
2 |
5 |
2 |
22 |
0.21% |
|
|
Westmoreland |
39 |
54 |
32 |
38 |
34 |
197 |
1.91% |
|
|
Wyoming |
5 |
3 |
4 |
3 |
8 |
23 |
0.22% |
|
|
York |
77 |
92 |
87 |
70 |
82 |
408 |
3.96% |
|
|
Grand Total |
2,293 |
2,163 |
1,941 |
1,960 |
1,934 |
10,291 |
N/A |
|