
News
Pennsylvania sees recent increase in retail theft offenses after years in decline

December 08, 2023
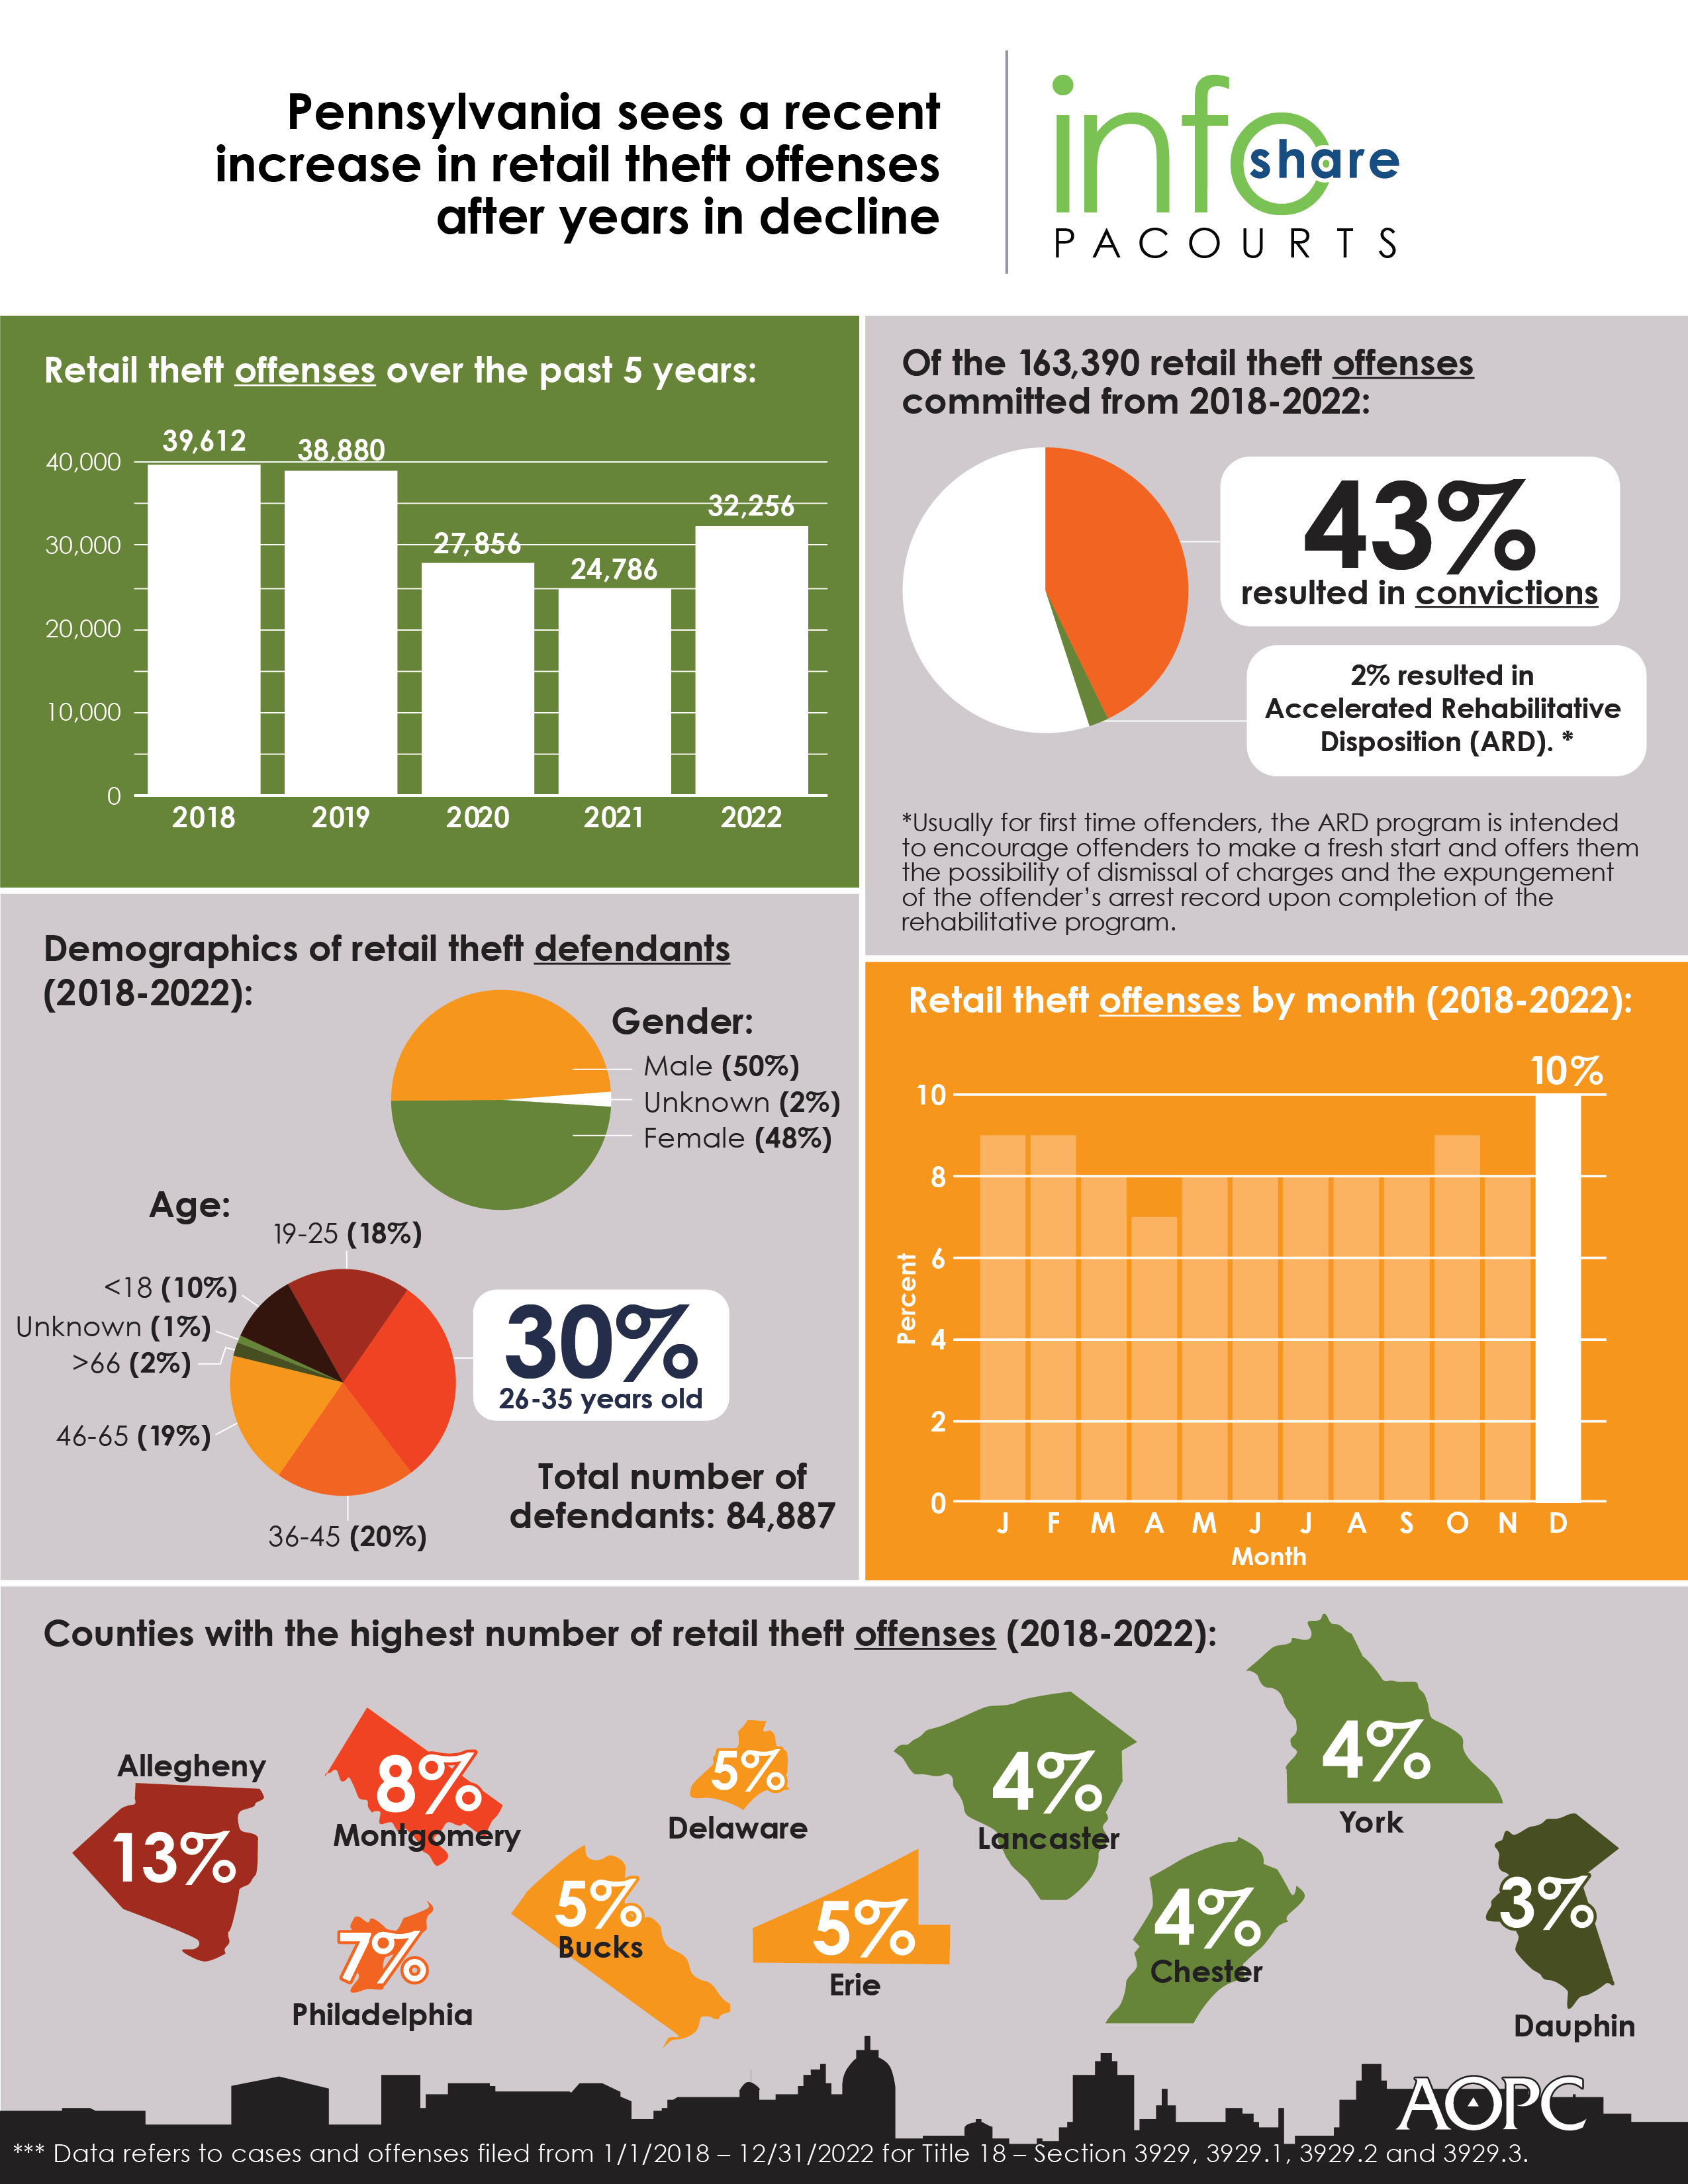
Retail theft offenses in Pennsylvania increased by 30 percent from 2021 to 2022, following years in decline.
The infographic highlights retail theft data from 2018 to 2022 including the statewide number of retail theft offenses by month, the top 10 counties with the highest number of retail theft offenses and statewide defendant demographics.
A high-resolution file of the graphic is available for download at www.pacourts.us under Media Resources.
PA Courts InfoShare is a monthly product of the Administrative Office of Pennsylvania Courts (AOPC) that visually highlights the work of the courts with interesting data and statistics obtained through the judiciary’s case management systems, interactive dashboards and other research. Reproduction is permissible with source cited.
##
Media contact: Casey Scheffler, 610-425-1712
Editor’s Note: County-by-county retail theft offenses filed from 1/1/2018-12/31/2022
|
County / Section |
2018 |
2019 |
2020 |
2021 |
2022 |
Total |
Percentage of Total |
|
Adams |
85 |
115 |
81 |
54 |
133 |
468 |
0.29% |
|
3929 |
85 |
115 |
79 |
54 |
133 |
466 |
0.29% |
|
3929.1 |
0 |
0 |
2 |
0 |
0 |
2 |
0.00% |
|
Allegheny |
5,485 |
5,389 |
3,281 |
2,688 |
3,708 |
20,551 |
12.58% |
|
3929 |
5,421 |
5,341 |
3,267 |
2,674 |
3,693 |
20,396 |
12.48% |
|
3929.1 |
1 |
1 |
1 |
0 |
1 |
4 |
0.00% |
|
3929.2 |
6 |
11 |
0 |
0 |
0 |
17 |
0.01% |
|
3929.3 |
57 |
36 |
13 |
14 |
14 |
134 |
0.08% |
|
Armstrong |
202 |
119 |
143 |
29 |
102 |
595 |
0.36% |
|
3929 |
201 |
116 |
143 |
29 |
102 |
591 |
0.36% |
|
3929.1 |
1 |
0 |
0 |
0 |
0 |
1 |
0.00% |
|
3929.3 |
0 |
3 |
0 |
0 |
0 |
3 |
0.00% |
|
Beaver |
808 |
630 |
588 |
370 |
520 |
2,916 |
1.78% |
|
3929 |
808 |
629 |
587 |
370 |
520 |
2,914 |
1.78% |
|
3929.1 |
0 |
1 |
0 |
0 |
0 |
1 |
0.00% |
|
3929.2 |
0 |
0 |
1 |
0 |
0 |
1 |
0.00% |
|
Bedford |
57 |
53 |
50 |
34 |
52 |
246 |
0.15% |
|
3929 |
57 |
53 |
50 |
34 |
52 |
246 |
0.15% |
|
Berks |
905 |
830 |
776 |
701 |
1,013 |
4,225 |
2.59% |
|
3929 |
903 |
830 |
775 |
700 |
1,013 |
4,221 |
2.58% |
|
3929.2 |
2 |
0 |
1 |
1 |
0 |
4 |
0.00% |
|
Blair |
452 |
512 |
398 |
357 |
423 |
2,142 |
1.31% |
|
3929 |
452 |
512 |
398 |
357 |
423 |
2,142 |
1.31% |
|
Bradford |
188 |
149 |
151 |
139 |
118 |
745 |
0.46% |
|
3929 |
188 |
149 |
151 |
139 |
118 |
745 |
0.46% |
|
Bucks |
1,490 |
1,708 |
1,427 |
1,459 |
1,957 |
8,041 |
4.92% |
|
3929 |
1,484 |
1,692 |
1,424 |
1,451 |
1,951 |
8,002 |
4.90% |
|
3929.1 |
1 |
1 |
0 |
5 |
0 |
7 |
0.00% |
|
3929.2 |
0 |
3 |
3 |
3 |
3 |
12 |
0.01% |
|
3929.3 |
5 |
12 |
0 |
0 |
3 |
20 |
0.01% |
|
Butler |
804 |
610 |
518 |
570 |
697 |
3,199 |
1.96% |
|
3929 |
804 |
605 |
517 |
566 |
697 |
3,189 |
1.95% |
|
3929.2 |
0 |
2 |
1 |
0 |
0 |
3 |
0.00% |
|
3929.3 |
0 |
3 |
0 |
4 |
0 |
7 |
0.00% |
|
Cambria |
517 |
334 |
238 |
140 |
251 |
1,480 |
0.91% |
|
3929 |
517 |
334 |
238 |
140 |
251 |
1,480 |
0.91% |
|
Cameron |
5 |
1 |
2 |
2 |
6 |
16 |
0.01% |
|
3929 |
5 |
1 |
2 |
2 |
5 |
15 |
0.01% |
|
3929.3 |
0 |
0 |
0 |
0 |
1 |
1 |
0.00% |
|
Carbon |
209 |
99 |
142 |
92 |
62 |
604 |
0.37% |
|
3929 |
209 |
99 |
142 |
92 |
62 |
604 |
0.37% |
|
Centre |
280 |
264 |
340 |
121 |
501 |
1,506 |
0.92% |
|
3929 |
279 |
263 |
340 |
121 |
501 |
1,504 |
0.92% |
|
3929.1 |
1 |
0 |
0 |
0 |
0 |
1 |
0.00% |
|
3929.2 |
0 |
1 |
0 |
0 |
0 |
1 |
0.00% |
|
Chester |
1,332 |
1,161 |
955 |
1,112 |
1,202 |
5,762 |
3.53% |
|
3929 |
1,319 |
1,150 |
951 |
1,102 |
1,199 |
5,721 |
3.50% |
|
3929.1 |
1 |
1 |
0 |
0 |
0 |
2 |
0.00% |
|
3929.2 |
11 |
5 |
3 |
1 |
2 |
22 |
0.01% |
|
3929.3 |
1 |
5 |
1 |
9 |
1 |
17 |
0.01% |
|
Clarion |
109 |
87 |
52 |
61 |
48 |
357 |
0.22% |
|
3929 |
107 |
87 |
52 |
61 |
48 |
355 |
0.22% |
|
3929.3 |
2 |
0 |
0 |
0 |
0 |
2 |
0.00% |
|
Clearfield |
147 |
206 |
196 |
167 |
205 |
921 |
0.56% |
|
3929 |
146 |
206 |
195 |
167 |
205 |
919 |
0.56% |
|
3929.1 |
1 |
0 |
0 |
0 |
0 |
1 |
0.00% |
|
3929.3 |
0 |
0 |
1 |
0 |
0 |
1 |
0.00% |
|
Clinton |
93 |
103 |
82 |
40 |
63 |
381 |
0.23% |
|
3929 |
93 |
103 |
82 |
40 |
63 |
381 |
0.23% |
|
Columbia |
164 |
123 |
183 |
186 |
109 |
765 |
0.47% |
|
3929 |
164 |
123 |
183 |
186 |
109 |
765 |
0.47% |
|
Crawford |
168 |
197 |
139 |
147 |
251 |
902 |
0.55% |
|
3929 |
168 |
197 |
139 |
147 |
250 |
901 |
0.55% |
|
3929.1 |
0 |
0 |
0 |
0 |
1 |
1 |
0.00% |
|
Cumberland |
954 |
923 |
839 |
1,013 |
1,082 |
4,811 |
2.94% |
|
3929 |
940 |
920 |
833 |
1,011 |
1,067 |
4,771 |
2.92% |
|
3929.1 |
0 |
0 |
0 |
0 |
1 |
1 |
0.00% |
|
3929.2 |
7 |
0 |
0 |
0 |
0 |
7 |
0.00% |
|
3929.3 |
7 |
3 |
6 |
2 |
14 |
32 |
0.02% |
|
Dauphin |
1,144 |
1,153 |
1,022 |
838 |
882 |
5,039 |
3.08% |
|
3929 |
1,144 |
1,152 |
1,022 |
835 |
878 |
5,031 |
3.08% |
|
3929.3 |
0 |
1 |
0 |
3 |
4 |
8 |
0.00% |
|
Delaware |
1,921 |
2,105 |
1,294 |
1,438 |
1,899 |
8,657 |
5.30% |
|
3929 |
1,918 |
2,098 |
1,282 |
1,431 |
1,806 |
8,535 |
5.22% |
|
3929.2 |
3 |
5 |
3 |
1 |
4 |
16 |
0.01% |
|
3929.3 |
0 |
2 |
9 |
6 |
89 |
106 |
0.06% |
|
Elk |
163 |
112 |
92 |
100 |
124 |
591 |
0.36% |
|
3929 |
163 |
112 |
92 |
100 |
124 |
591 |
0.36% |
|
Erie |
1,415 |
1,700 |
1,833 |
1,629 |
1,343 |
7,920 |
4.85% |
|
3929 |
1,412 |
1,700 |
1,833 |
1,629 |
1,343 |
7,917 |
4.85% |
|
3929.3 |
3 |
0 |
0 |
0 |
0 |
3 |
0.00% |
|
Fayette |
579 |
553 |
394 |
298 |
412 |
2,236 |
1.37% |
|
3929 |
579 |
553 |
394 |
298 |
412 |
2,236 |
1.37% |
|
Forest |
1 |
0 |
0 |
5 |
2 |
8 |
0.00% |
|
3929 |
1 |
0 |
0 |
5 |
2 |
8 |
0.00% |
|
Franklin |
390 |
455 |
405 |
477 |
391 |
2,118 |
1.30% |
|
3929 |
390 |
455 |
405 |
477 |
391 |
2,118 |
1.30% |
|
Fulton |
21 |
19 |
14 |
8 |
15 |
77 |
0.05% |
|
3929 |
21 |
19 |
14 |
8 |
15 |
77 |
0.05% |
|
Greene |
109 |
110 |
71 |
36 |
62 |
388 |
0.24% |
|
3929 |
109 |
110 |
71 |
36 |
62 |
388 |
0.24% |
|
Huntingdon |
75 |
58 |
29 |
54 |
64 |
280 |
0.17% |
|
3929 |
74 |
58 |
29 |
54 |
64 |
279 |
0.17% |
|
3929.2 |
1 |
0 |
0 |
0 |
0 |
1 |
0.00% |
|
Indiana |
275 |
456 |
309 |
154 |
166 |
1,360 |
0.83% |
|
3929 |
275 |
453 |
309 |
154 |
166 |
1,357 |
0.83% |
|
3929.3 |
0 |
3 |
0 |
0 |
0 |
3 |
0.00% |
|
Jefferson |
33 |
81 |
42 |
20 |
28 |
204 |
0.12% |
|
3929 |
33 |
81 |
42 |
20 |
28 |
204 |
0.12% |
|
Juniata |
12 |
10 |
4 |
11 |
9 |
46 |
0.03% |
|
3929 |
12 |
10 |
4 |
11 |
9 |
46 |
0.03% |
|
Lackawanna |
528 |
454 |
343 |
272 |
396 |
1,993 |
1.22% |
|
3929 |
524 |
454 |
341 |
270 |
396 |
1,985 |
1.21% |
|
3929.2 |
4 |
0 |
2 |
1 |
0 |
7 |
0.00% |
|
3929.3 |
0 |
0 |
0 |
1 |
0 |
1 |
0.00% |
|
Lancaster |
1,711 |
1,267 |
798 |
851 |
1,179 |
5,806 |
3.55% |
|
3929 |
1,711 |
1,262 |
789 |
842 |
1,178 |
5,782 |
3.54% |
|
3929.1 |
0 |
2 |
0 |
1 |
0 |
3 |
0.00% |
|
3929.2 |
0 |
1 |
0 |
0 |
1 |
2 |
0.00% |
|
3929.3 |
0 |
2 |
9 |
8 |
0 |
19 |
0.01% |
|
Lawrence |
301 |
187 |
267 |
137 |
177 |
1,069 |
0.65% |
|
3929 |
301 |
186 |
267 |
137 |
177 |
1,068 |
0.65% |
|
3929.3 |
0 |
1 |
0 |
0 |
0 |
1 |
0.00% |
|
Lebanon |
416 |
748 |
376 |
176 |
173 |
1,889 |
1.16% |
|
3929 |
416 |
748 |
376 |
176 |
173 |
1,889 |
1.16% |
|
Lehigh |
1,349 |
1,319 |
615 |
491 |
764 |
4,538 |
2.78% |
|
3929 |
1,349 |
1,319 |
614 |
491 |
764 |
4,537 |
2.78% |
|
3929.2 |
0 |
0 |
1 |
0 |
0 |
1 |
0.00% |
|
Luzerne |
908 |
1,059 |
806 |
568 |
760 |
4,101 |
2.51% |
|
3929 |
908 |
1,059 |
801 |
568 |
760 |
4,096 |
2.51% |
|
3929.3 |
0 |
0 |
5 |
0 |
0 |
5 |
0.00% |
|
Lycoming |
308 |
344 |
225 |
165 |
193 |
1,235 |
0.76% |
|
3929 |
308 |
344 |
225 |
165 |
193 |
1,235 |
0.76% |
|
McKean |
101 |
88 |
58 |
71 |
189 |
507 |
0.31% |
|
3929 |
101 |
88 |
58 |
71 |
189 |
507 |
0.31% |
|
Mercer |
625 |
607 |
453 |
253 |
328 |
2,266 |
1.39% |
|
3929 |
624 |
606 |
453 |
252 |
325 |
2,260 |
1.38% |
|
3929.2 |
1 |
1 |
0 |
1 |
3 |
6 |
0.00% |
|
Mifflin |
61 |
106 |
61 |
63 |
97 |
388 |
0.24% |
|
3929 |
60 |
106 |
61 |
63 |
97 |
387 |
0.24% |
|
3929.1 |
1 |
0 |
0 |
0 |
0 |
1 |
0.00% |
|
Monroe |
823 |
808 |
567 |
486 |
657 |
3,341 |
2.04% |
|
3929 |
819 |
808 |
559 |
485 |
652 |
3,323 |
2.03% |
|
3929.3 |
4 |
0 |
8 |
1 |
5 |
18 |
0.01% |
|
Montgomery |
3,030 |
2,811 |
1,821 |
2,029 |
3,436 |
13,127 |
8.03% |
|
3929 |
2,959 |
2,790 |
1,806 |
2,015 |
3,333 |
12,903 |
7.90% |
|
3929.1 |
0 |
2 |
0 |
0 |
0 |
2 |
0.00% |
|
3929.2 |
54 |
17 |
15 |
8 |
13 |
107 |
0.07% |
|
3929.3 |
17 |
2 |
0 |
6 |
90 |
115 |
0.07% |
|
Montour |
22 |
19 |
17 |
18 |
7 |
83 |
0.05% |
|
3929 |
20 |
19 |
17 |
18 |
7 |
81 |
0.05% |
|
3929.3 |
2 |
0 |
0 |
0 |
0 |
2 |
0.00% |
|
Northampton |
586 |
614 |
330 |
256 |
425 |
2,211 |
1.35% |
|
3929 |
584 |
612 |
330 |
256 |
425 |
2,207 |
1.35% |
|
3929.2 |
2 |
2 |
0 |
0 |
0 |
4 |
0.00% |
|
Northumberland |
299 |
235 |
146 |
101 |
91 |
872 |
0.53% |
|
3929 |
299 |
235 |
146 |
101 |
91 |
872 |
0.53% |
|
Perry |
22 |
24 |
58 |
27 |
7 |
138 |
0.08% |
|
3929 |
22 |
24 |
58 |
27 |
7 |
138 |
0.08% |
|
Philadelphia |
3,297 |
3,184 |
1,856 |
1,383 |
1,810 |
11,530 |
7.06% |
|
3929 |
3,289 |
3,182 |
1,853 |
1,383 |
1,807 |
11,514 |
7.05% |
|
3929.1 |
0 |
0 |
0 |
0 |
1 |
1 |
0.00% |
|
3929.2 |
1 |
2 |
1 |
0 |
1 |
5 |
0.00% |
|
3929.3 |
7 |
0 |
2 |
0 |
1 |
10 |
0.01% |
|
Pike |
53 |
46 |
77 |
82 |
195 |
453 |
0.28% |
|
3929 |
53 |
46 |
77 |
82 |
195 |
453 |
0.28% |
|
Potter |
3 |
4 |
2 |
4 |
7 |
20 |
0.01% |
|
3929 |
3 |
4 |
2 |
4 |
7 |
20 |
0.01% |
|
Schuylkill |
353 |
485 |
288 |
178 |
221 |
1,525 |
0.93% |
|
3929 |
353 |
485 |
288 |
178 |
220 |
1,524 |
0.93% |
|
3929.3 |
0 |
0 |
0 |
0 |
1 |
1 |
0.00% |
|
Snyder |
131 |
215 |
93 |
250 |
124 |
813 |
0.50% |
|
3929 |
130 |
215 |
93 |
250 |
124 |
812 |
0.50% |
|
3929.1 |
1 |
0 |
0 |
0 |
0 |
1 |
0.00% |
|
Somerset |
137 |
177 |
124 |
90 |
102 |
630 |
0.39% |
|
3929 |
137 |
177 |
123 |
90 |
102 |
629 |
0.38% |
|
3929.3 |
0 |
0 |
1 |
0 |
0 |
1 |
0.00% |
|
Sullivan |
0 |
1 |
0 |
4 |
3 |
8 |
0.00% |
|
3929 |
0 |
1 |
0 |
4 |
3 |
8 |
0.00% |
|
Susquehanna |
21 |
11 |
17 |
6 |
5 |
60 |
0.04% |
|
3929 |
21 |
11 |
17 |
6 |
5 |
60 |
0.04% |
|
Tioga |
61 |
58 |
48 |
28 |
38 |
233 |
0.14% |
|
3929 |
61 |
58 |
48 |
28 |
38 |
233 |
0.14% |
|
Union |
125 |
106 |
48 |
95 |
56 |
430 |
0.26% |
|
3929 |
125 |
106 |
48 |
95 |
56 |
430 |
0.26% |
|
Venango |
109 |
93 |
70 |
45 |
74 |
391 |
0.24% |
|
3929 |
109 |
93 |
70 |
45 |
74 |
391 |
0.24% |
|
Warren |
114 |
101 |
120 |
231 |
233 |
799 |
0.49% |
|
3929 |
114 |
101 |
120 |
231 |
233 |
799 |
0.49% |
|
Washington |
630 |
552 |
390 |
315 |
393 |
2,280 |
1.40% |
|
3929 |
630 |
552 |
390 |
315 |
393 |
2,280 |
1.40% |
|
Wayne |
100 |
71 |
84 |
108 |
124 |
487 |
0.30% |
|
3929 |
100 |
71 |
84 |
108 |
124 |
487 |
0.30% |
|
Westmoreland |
1,114 |
1,324 |
808 |
750 |
1,012 |
5,008 |
3.07% |
|
3929 |
1,112 |
1,321 |
808 |
750 |
1,010 |
5,001 |
3.06% |
|
3929.1 |
1 |
0 |
0 |
0 |
0 |
1 |
0.00% |
|
3929.2 |
0 |
0 |
0 |
0 |
1 |
1 |
0.00% |
|
3929.3 |
1 |
3 |
0 |
0 |
1 |
5 |
0.00% |
|
Wyoming |
51 |
52 |
24 |
26 |
32 |
185 |
0.11% |
|
3929 |
51 |
52 |
24 |
26 |
32 |
185 |
0.11% |
|
York |
1,631 |
1,285 |
776 |
677 |
1,048 |
5,417 |
3.32% |
|
3929 |
1,631 |
1,280 |
774 |
677 |
1,046 |
5,408 |
3.31% |
|
3929.3 |
0 |
5 |
2 |
0 |
2 |
9 |
0.01% |
|
Grand Total |
39,612 |
38,880 |
27,856 |
24,786 |
32,256 |
163,390 |
|