
News
Back to school: Traffic citations in school zones

August 10, 2023
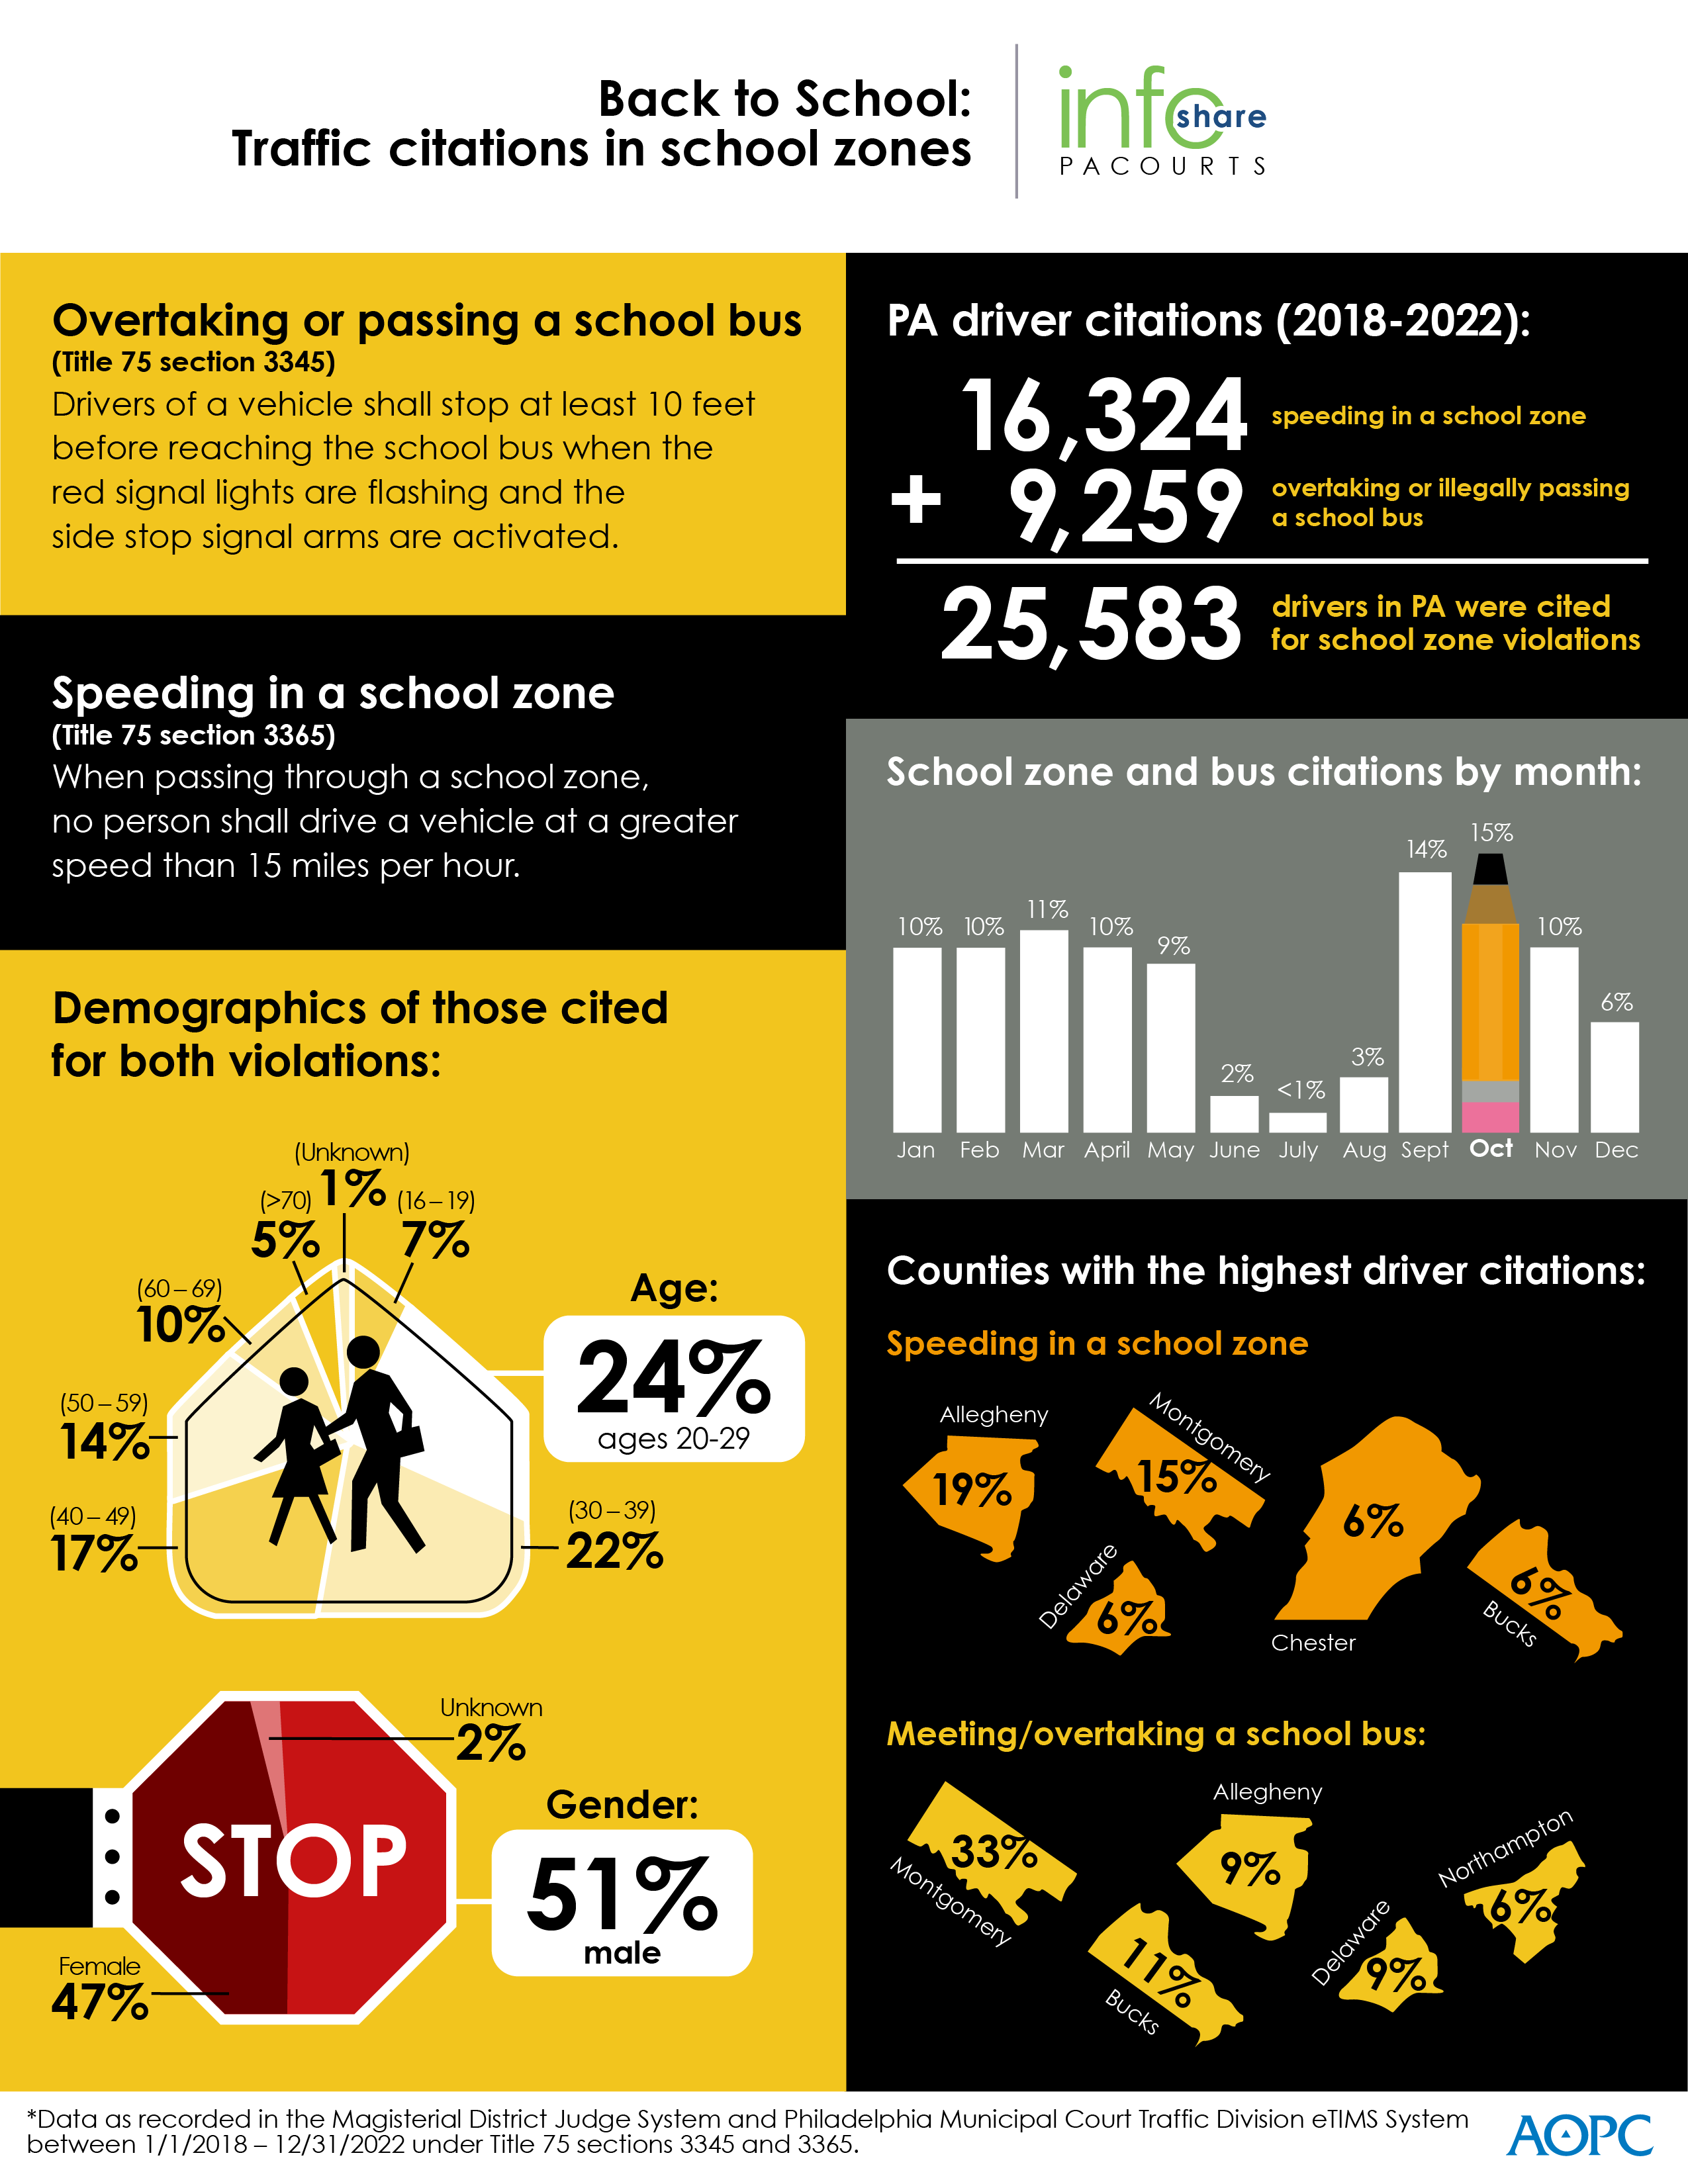
In Pennsylvania, two school zone traffic laws have been cited more than 25,583 times over the past five years (2018-2022). The infographic below highlights key data and demographics about violations for speeding in school zones or illegally passing a school bus.
Download a high-resolution version of the graphic. County-level detail is provided at the end of the release.
Title 75 School Zone violations issued from 1/1/2018 through 12/31/2022, as recorded in the Magisterial District Judge System (MDJS) and Philadelphia Municipal Court Traffic Division eTIMS System.; County Composition
|
Section / Offense Description |
Filed Year |
Total |
Percentage of Overall |
||||
|
2018 |
2019 |
2020 |
2021 |
2022 |
|||
|
3345 / Meeting/Overtaking School Bus |
2,283 |
2,659 |
990 |
1,503 |
1,824 |
9,259 |
N/A |
|
Adams |
4 |
13 |
7 |
8 |
6 |
38 |
0.41% |
|
Allegheny |
433 |
564 |
169 |
294 |
313 |
1,773 |
19.15% |
|
Armstrong |
8 |
5 |
1 |
4 |
1 |
19 |
0.21% |
|
Beaver |
15 |
9 |
4 |
16 |
49 |
93 |
1.00% |
|
Bedford |
3 |
5 |
8 |
6 |
6 |
28 |
0.30% |
|
Berks |
122 |
83 |
23 |
39 |
51 |
318 |
3.43% |
|
Blair |
5 |
14 |
9 |
8 |
8 |
44 |
0.48% |
|
Bradford |
7 |
4 |
3 |
8 |
14 |
36 |
0.39% |
|
Bucks |
169 |
196 |
45 |
71 |
115 |
596 |
6.44% |
|
Butler |
64 |
82 |
59 |
61 |
55 |
321 |
3.47% |
|
Cambria |
17 |
11 |
6 |
21 |
13 |
68 |
0.73% |
|
Carbon |
6 |
5 |
1 |
6 |
4 |
22 |
0.24% |
|
Centre |
31 |
40 |
7 |
16 |
7 |
101 |
1.09% |
|
Chester |
155 |
153 |
50 |
75 |
118 |
551 |
5.95% |
|
Clarion |
7 |
4 |
1 |
4 |
2 |
18 |
0.19% |
|
Clearfield |
7 |
4 |
4 |
2 |
4 |
21 |
0.23% |
|
Clinton |
2 |
8 |
1 |
0 |
1 |
12 |
0.13% |
|
Columbia |
14 |
23 |
6 |
8 |
14 |
65 |
0.70% |
|
Crawford |
9 |
4 |
3 |
3 |
3 |
22 |
0.24% |
|
Cumberland |
30 |
33 |
16 |
29 |
34 |
142 |
1.53% |
|
Dauphin |
63 |
62 |
23 |
35 |
35 |
218 |
2.35% |
|
Delaware |
125 |
193 |
58 |
96 |
90 |
562 |
6.07% |
|
Elk |
3 |
3 |
0 |
3 |
1 |
10 |
0.11% |
|
Erie |
49 |
46 |
24 |
53 |
41 |
213 |
2.30% |
|
Fayette |
5 |
9 |
4 |
5 |
14 |
37 |
0.40% |
|
Forest |
0 |
0 |
0 |
1 |
2 |
3 |
0.03% |
|
Franklin |
7 |
12 |
4 |
9 |
24 |
56 |
0.60% |
|
Fulton |
4 |
1 |
2 |
0 |
0 |
7 |
0.08% |
|
Greene |
0 |
7 |
0 |
1 |
5 |
13 |
0.14% |
|
Huntingdon |
2 |
3 |
2 |
0 |
2 |
9 |
0.10% |
|
Indiana |
5 |
13 |
3 |
1 |
6 |
28 |
0.30% |
|
Jefferson |
5 |
8 |
3 |
4 |
7 |
27 |
0.29% |
|
Juniata |
2 |
1 |
0 |
1 |
3 |
7 |
0.08% |
|
Lackawanna |
39 |
21 |
8 |
13 |
20 |
101 |
1.09% |
|
Lancaster |
75 |
80 |
41 |
55 |
47 |
298 |
3.22% |
|
Lawrence |
9 |
6 |
1 |
5 |
1 |
22 |
0.24% |
|
Lebanon |
6 |
7 |
2 |
6 |
7 |
28 |
0.30% |
|
Lehigh |
60 |
64 |
29 |
93 |
52 |
298 |
3.22% |
|
Luzerne |
36 |
53 |
14 |
27 |
34 |
164 |
1.77% |
|
Lycoming |
7 |
12 |
6 |
3 |
4 |
32 |
0.35% |
|
McKean |
4 |
2 |
3 |
3 |
9 |
21 |
0.23% |
|
Mercer |
9 |
7 |
5 |
5 |
7 |
33 |
0.36% |
|
Mifflin |
9 |
10 |
1 |
15 |
10 |
45 |
0.49% |
|
Monroe |
12 |
20 |
10 |
15 |
14 |
71 |
0.77% |
|
Montgomery |
333 |
378 |
160 |
193 |
282 |
1,346 |
14.54% |
|
Montour |
0 |
2 |
0 |
3 |
1 |
6 |
0.06% |
|
Northampton |
34 |
56 |
20 |
33 |
27 |
170 |
1.84% |
|
Northumberland |
11 |
10 |
11 |
8 |
19 |
59 |
0.64% |
|
Philadelphia |
64 |
68 |
23 |
8 |
13 |
176 |
1.90% |
|
Perry |
3 |
2 |
1 |
1 |
3 |
10 |
0.11% |
|
Pike |
2 |
1 |
2 |
2 |
2 |
9 |
0.10% |
|
Potter |
2 |
2 |
2 |
2 |
1 |
9 |
0.10% |
|
Schuylkill |
14 |
15 |
8 |
16 |
14 |
67 |
0.72% |
|
Snyder |
2 |
8 |
4 |
3 |
7 |
24 |
0.26% |
|
Somerset |
1 |
3 |
0 |
2 |
4 |
10 |
0.11% |
|
Sullivan |
0 |
1 |
0 |
0 |
0 |
1 |
0.01% |
|
Susquehanna |
3 |
3 |
1 |
1 |
0 |
8 |
0.09% |
|
Tioga |
1 |
3 |
4 |
2 |
2 |
12 |
0.13% |
|
Union |
3 |
6 |
1 |
4 |
3 |
17 |
0.18% |
|
Venango |
15 |
7 |
5 |
11 |
4 |
42 |
0.45% |
|
Warren |
1 |
2 |
2 |
1 |
2 |
8 |
0.09% |
|
Washington |
24 |
35 |
14 |
9 |
19 |
101 |
1.09% |
|
Wayne |
0 |
9 |
2 |
2 |
4 |
17 |
0.18% |
|
Westmoreland |
36 |
32 |
21 |
16 |
38 |
143 |
1.54% |
|
Wyoming |
4 |
9 |
7 |
4 |
12 |
36 |
0.39% |
|
York |
86 |
107 |
36 |
54 |
114 |
397 |
4.29% |
|
3365 / Speeding In School Zone |
3,530 |
5,014 |
1,933 |
2,815 |
3,032 |
16,324 |
N/A |
|
Adams |
52 |
62 |
38 |
21 |
17 |
190 |
1.16% |
|
Allegheny |
453 |
482 |
181 |
133 |
254 |
1,503 |
9.21% |
|
Armstrong |
2 |
0 |
0 |
8 |
6 |
16 |
0.10% |
|
Beaver |
54 |
106 |
54 |
98 |
127 |
439 |
2.69% |
|
Bedford |
2 |
3 |
1 |
0 |
1 |
7 |
0.04% |
|
Berks |
119 |
130 |
37 |
90 |
68 |
444 |
2.72% |
|
Blair |
17 |
4 |
1 |
5 |
0 |
27 |
0.17% |
|
Bradford |
0 |
0 |
0 |
0 |
1 |
1 |
0.01% |
|
Bucks |
507 |
553 |
197 |
275 |
294 |
1,826 |
11.19% |
|
Butler |
28 |
34 |
12 |
14 |
3 |
91 |
0.56% |
|
Cambria |
16 |
17 |
13 |
11 |
27 |
84 |
0.51% |
|
Cameron |
1 |
0 |
1 |
1 |
0 |
3 |
0.02% |
|
Carbon |
15 |
19 |
4 |
2 |
21 |
61 |
0.37% |
|
Centre |
7 |
2 |
2 |
7 |
6 |
24 |
0.15% |
|
Chester |
174 |
146 |
27 |
59 |
136 |
542 |
3.32% |
|
Clarion |
1 |
0 |
0 |
0 |
0 |
1 |
0.01% |
|
Clearfield |
2 |
0 |
0 |
0 |
0 |
2 |
0.01% |
|
Clinton |
0 |
2 |
1 |
0 |
0 |
3 |
0.02% |
|
Columbia |
1 |
1 |
1 |
0 |
0 |
3 |
0.02% |
|
Crawford |
26 |
8 |
4 |
0 |
6 |
44 |
0.27% |
|
Cumberland |
37 |
69 |
18 |
26 |
28 |
178 |
1.09% |
|
Dauphin |
23 |
41 |
39 |
21 |
32 |
156 |
0.96% |
|
Delaware |
231 |
532 |
71 |
249 |
342 |
1,425 |
8.73% |
|
Elk |
6 |
1 |
1 |
1 |
6 |
15 |
0.09% |
|
Erie |
90 |
133 |
112 |
128 |
79 |
542 |
3.32% |
|
Fayette |
0 |
1 |
1 |
1 |
0 |
3 |
0.02% |
|
Franklin |
22 |
56 |
45 |
33 |
31 |
187 |
1.15% |
|
Fulton |
2 |
1 |
2 |
2 |
1 |
8 |
0.05% |
|
Greene |
1 |
1 |
1 |
14 |
2 |
19 |
0.12% |
|
Huntingdon |
0 |
2 |
1 |
0 |
2 |
5 |
0.03% |
|
Indiana |
7 |
0 |
4 |
11 |
11 |
33 |
0.20% |
|
Jefferson |
1 |
5 |
10 |
13 |
129 |
158 |
0.97% |
|
Juniata |
0 |
0 |
0 |
2 |
1 |
3 |
0.02% |
|
Lackawanna |
19 |
22 |
1 |
20 |
11 |
73 |
0.45% |
|
Lancaster |
12 |
19 |
26 |
135 |
50 |
242 |
1.48% |
|
Lawrence |
3 |
3 |
0 |
1 |
6 |
13 |
0.08% |
|
Lebanon |
17 |
54 |
17 |
16 |
33 |
137 |
0.84% |
|
Lehigh |
22 |
74 |
16 |
9 |
44 |
165 |
1.01% |
|
Luzerne |
76 |
33 |
15 |
85 |
27 |
236 |
1.45% |
|
Lycoming |
20 |
17 |
0 |
0 |
1 |
38 |
0.23% |
|
McKean |
2 |
2 |
0 |
2 |
0 |
6 |
0.04% |
|
Mercer |
40 |
23 |
2 |
32 |
58 |
155 |
0.95% |
|
Mifflin |
0 |
0 |
0 |
0 |
1 |
1 |
0.01% |
|
Monroe |
0 |
0 |
0 |
3 |
0 |
3 |
0.02% |
|
Montgomery |
1,011 |
1,833 |
742 |
933 |
791 |
5,310 |
32.53% |
|
Montour |
0 |
0 |
0 |
1 |
0 |
1 |
0.01% |
|
Northampton |
191 |
262 |
115 |
155 |
177 |
900 |
5.51% |
|
Northumberland |
3 |
0 |
1 |
4 |
3 |
11 |
0.07% |
|
Philadelphia |
3 |
5 |
0 |
1 |
16 |
25 |
0.15% |
|
Potter |
0 |
7 |
0 |
0 |
10 |
17 |
0.10% |
|
Schuylkill |
15 |
14 |
1 |
0 |
0 |
30 |
0.18% |
|
Snyder |
0 |
0 |
0 |
2 |
3 |
5 |
0.03% |
|
Somerset |
27 |
9 |
2 |
1 |
1 |
40 |
0.25% |
|
Tioga |
3 |
0 |
0 |
0 |
0 |
3 |
0.02% |
|
Union |
8 |
11 |
9 |
2 |
4 |
34 |
0.21% |
|
Venango |
19 |
17 |
9 |
76 |
69 |
190 |
1.16% |
|
Warren |
0 |
0 |
1 |
0 |
0 |
1 |
0.01% |
|
Washington |
31 |
30 |
13 |
44 |
13 |
131 |
0.80% |
|
Wayne |
1 |
0 |
0 |
0 |
0 |
1 |
0.01% |
|
Westmoreland |
107 |
125 |
61 |
59 |
62 |
414 |
2.54% |
|
Wyoming |
2 |
1 |
0 |
0 |
0 |
3 |
0.02% |
|
York |
1 |
42 |
23 |
9 |
21 |
96 |
0.59% |
|
Grand Total |
5,813 |
7,673 |
2,923 |
4,318 |
4,856 |
25,583 |
N/A |
PA Courts InfoShare is a monthly product of the Administrative Office of Pennsylvania Courts (AOPC) that visually highlights the work of the courts with interesting data and statistics obtained through the judiciary’s case management systems, interactive dashboards and other research. Reproduction is permissible with source cited.
##
Media contact: Casey Scheffler, 610-425-1712