News
Underage Drinking Citations in Pennsylvania

February 03, 2023
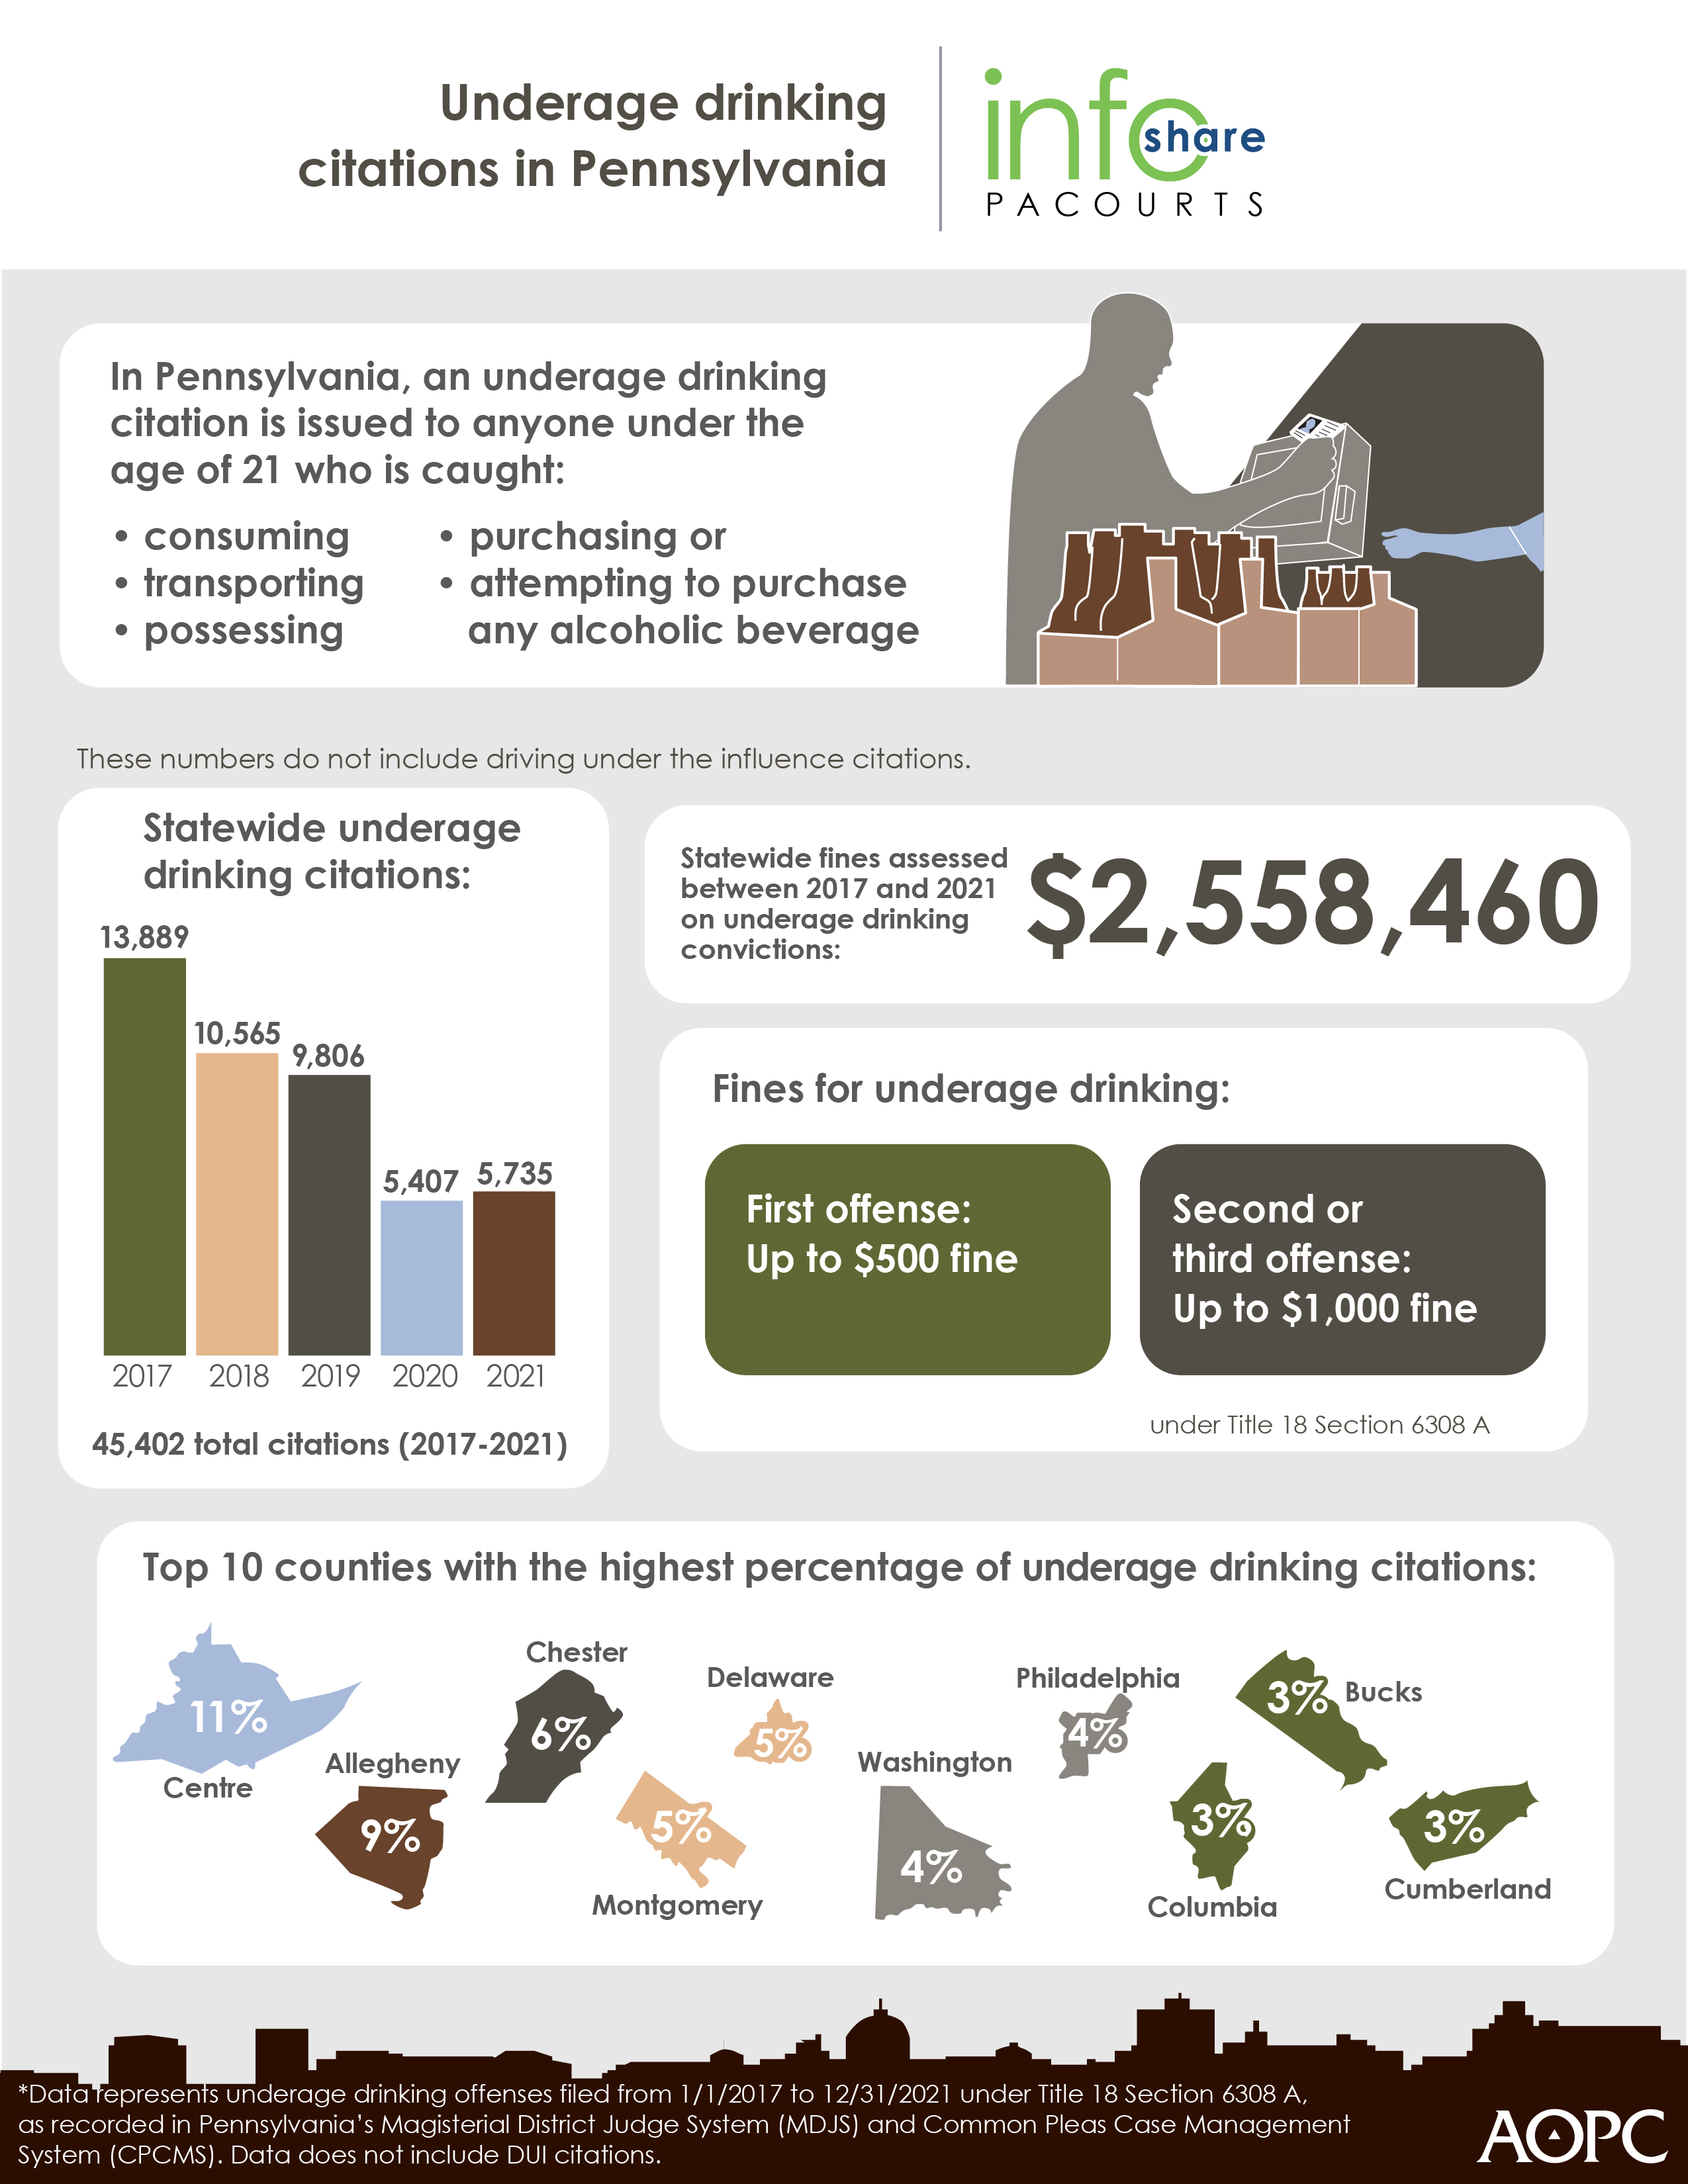
Over the past five years, underage drinking citations statewide totaled 45,402. In Pennsylvania, an underage drinking citation is issued to anyone under the age of 21 who is caught possessing, consuming, transporting, purchasing or attempting to purchase any alcoholic beverage. These numbers do not include driving under the influence citations.
The infographic below highlights key data and demographics about underage drinking in Pennsylvania. Download a high-resolution version of the graphic.
County-specific data is available at the end of the news release.
 PA Courts InfoShare is a monthly product of the Administrative Office of Pennsylvania Courts (AOPC) that visually highlights the work of the courts with interesting data and statistics obtained through the judiciary’s case management systems, interactive dashboards and other research. Reproduction is encouraged with source cited.
##
Media contact: Kim Bathgate, 717-231-3331
Editor’s Note:
|
Title 18 Section 6308 A (Purch Etc Alcoh Bev By A Minor) offenses filed from 1/1/2017 through 12/31/2021, as recorded in the Magisterial District Judge System (MDJS) and Common Pleas Case Management System (CPCMS). |
|||||||
|
County |
2017 |
2018 |
2019 |
2020 |
2021 |
Total |
Percentage of Overall |
|
Adams |
110 |
78 |
122 |
87 |
79 |
476 |
1.05% |
|
Allegheny |
1,313 |
976 |
711 |
437 |
470 |
3,907 |
8.61% |
|
Armstrong |
67 |
30 |
28 |
17 |
22 |
164 |
0.36% |
|
Beaver |
131 |
116 |
81 |
50 |
68 |
446 |
0.98% |
|
Bedford |
45 |
28 |
16 |
5 |
11 |
105 |
0.23% |
|
Berks |
327 |
238 |
244 |
158 |
125 |
1,092 |
2.41% |
|
Blair |
215 |
200 |
164 |
133 |
79 |
791 |
1.74% |
|
Bradford |
48 |
106 |
20 |
23 |
15 |
212 |
0.47% |
|
Bucks |
500 |
354 |
291 |
180 |
141 |
1,466 |
3.23% |
|
Butler |
303 |
199 |
277 |
140 |
159 |
1,078 |
2.37% |
|
Cambria |
75 |
60 |
97 |
51 |
60 |
343 |
0.76% |
|
Cameron |
4 |
5 |
0 |
0 |
2 |
11 |
0.02% |
|
Carbon |
31 |
18 |
15 |
29 |
22 |
115 |
0.25% |
|
Centre |
1,436 |
1,079 |
1,115 |
447 |
665 |
4,742 |
10.44% |
|
Chester |
877 |
594 |
579 |
289 |
494 |
2,833 |
6.24% |
|
Clarion |
95 |
91 |
65 |
38 |
30 |
319 |
0.70% |
|
Clearfield |
76 |
30 |
45 |
24 |
34 |
209 |
0.46% |
|
Clinton |
117 |
78 |
45 |
25 |
21 |
286 |
0.63% |
|
Columbia |
404 |
391 |
337 |
146 |
104 |
1,382 |
3.04% |
|
Crawford |
96 |
89 |
41 |
61 |
60 |
347 |
0.76% |
|
Cumberland |
412 |
254 |
258 |
210 |
212 |
1,346 |
2.96% |
|
Dauphin |
270 |
234 |
251 |
127 |
131 |
1,013 |
2.23% |
|
Delaware |
685 |
489 |
620 |
218 |
213 |
2,225 |
4.90% |
|
Elk |
29 |
36 |
24 |
23 |
24 |
136 |
0.30% |
|
Erie |
323 |
224 |
177 |
148 |
139 |
1,011 |
2.23% |
|
Fayette |
93 |
58 |
42 |
39 |
16 |
248 |
0.55% |
|
Forest |
1 |
4 |
1 |
1 |
0 |
7 |
0.02% |
|
Franklin |
101 |
90 |
63 |
53 |
42 |
349 |
0.77% |
|
Fulton |
11 |
5 |
8 |
0 |
5 |
29 |
0.06% |
|
Greene |
24 |
8 |
18 |
3 |
8 |
61 |
0.13% |
|
Huntingdon |
33 |
38 |
32 |
28 |
16 |
147 |
0.32% |
|
Indiana |
318 |
395 |
250 |
110 |
133 |
1,206 |
2.66% |
|
Jefferson |
38 |
21 |
23 |
12 |
20 |
114 |
0.25% |
|
Juniata |
26 |
8 |
9 |
10 |
16 |
69 |
0.15% |
|
Lackawanna |
259 |
242 |
300 |
106 |
151 |
1,058 |
2.33% |
|
Lancaster |
310 |
265 |
257 |
151 |
143 |
1,126 |
2.48% |
|
Lawrence |
52 |
55 |
34 |
35 |
33 |
209 |
0.46% |
|
Lebanon |
107 |
98 |
56 |
38 |
28 |
327 |
0.72% |
|
Lehigh |
169 |
100 |
100 |
41 |
45 |
455 |
1.00% |
|
Luzerne |
228 |
187 |
123 |
90 |
78 |
706 |
1.55% |
|
Lycoming |
154 |
115 |
88 |
53 |
67 |
477 |
1.05% |
|
McKean |
75 |
42 |
57 |
50 |
32 |
256 |
0.56% |
|
Mercer |
98 |
61 |
69 |
42 |
50 |
320 |
0.70% |
|
Mifflin |
46 |
25 |
23 |
18 |
24 |
136 |
0.30% |
|
Monroe |
190 |
98 |
68 |
36 |
45 |
437 |
0.96% |
|
Montgomery |
723 |
481 |
403 |
292 |
239 |
2,138 |
4.71% |
|
Montour |
4 |
4 |
13 |
4 |
8 |
33 |
0.07% |
|
Northampton |
458 |
233 |
181 |
123 |
119 |
1,114 |
2.45% |
|
Northumberland |
70 |
54 |
62 |
62 |
43 |
291 |
0.64% |
|
Perry |
26 |
33 |
20 |
17 |
14 |
110 |
0.24% |
|
Philadelphia |
458 |
498 |
428 |
169 |
299 |
1,852 |
4.08% |
|
Pike |
14 |
16 |
11 |
13 |
7 |
61 |
0.13% |
|
Potter |
10 |
2 |
11 |
22 |
18 |
63 |
0.14% |
|
Schuylkill |
76 |
75 |
76 |
36 |
17 |
280 |
0.62% |
|
Snyder |
22 |
19 |
38 |
37 |
16 |
132 |
0.29% |
|
Somerset |
71 |
51 |
50 |
44 |
12 |
228 |
0.50% |
|
Sullivan |
1 |
2 |
3 |
0 |
0 |
6 |
0.01% |
|
Susquehanna |
16 |
8 |
19 |
37 |
15 |
95 |
0.21% |
|
Tioga |
63 |
63 |
28 |
18 |
23 |
195 |
0.43% |
|
Union |
110 |
108 |
87 |
60 |
68 |
433 |
0.95% |
|
Venango |
45 |
27 |
18 |
27 |
14 |
131 |
0.29% |
|
Warren |
24 |
30 |
23 |
11 |
16 |
104 |
0.23% |
|
Washington |
605 |
438 |
674 |
98 |
183 |
1,998 |
4.40% |
|
Wayne |
16 |
10 |
17 |
11 |
8 |
62 |
0.14% |
|
Westmoreland |
304 |
219 |
145 |
114 |
128 |
910 |
2.00% |
|
Wyoming |
12 |
24 |
7 |
8 |
7 |
58 |
0.13% |
|
York |
439 |
258 |
248 |
222 |
149 |
1,316 |
2.90% |
|
Grand Total |
13,889 |
10,565 |
9,806 |
5,407 |
5,735 |
45,402 |
100.00% |